
Independent verification of Bun memory usage claims
July 29, 2026

Bun's memory numbers have been circulating for a week now. Idle CPU down, memory down, a build-time leak fixed by a runtime rewrite nobody saw coming. Most of the discussion just repeats the numbers. This one measures them.
The rewrite that produced these numbers#
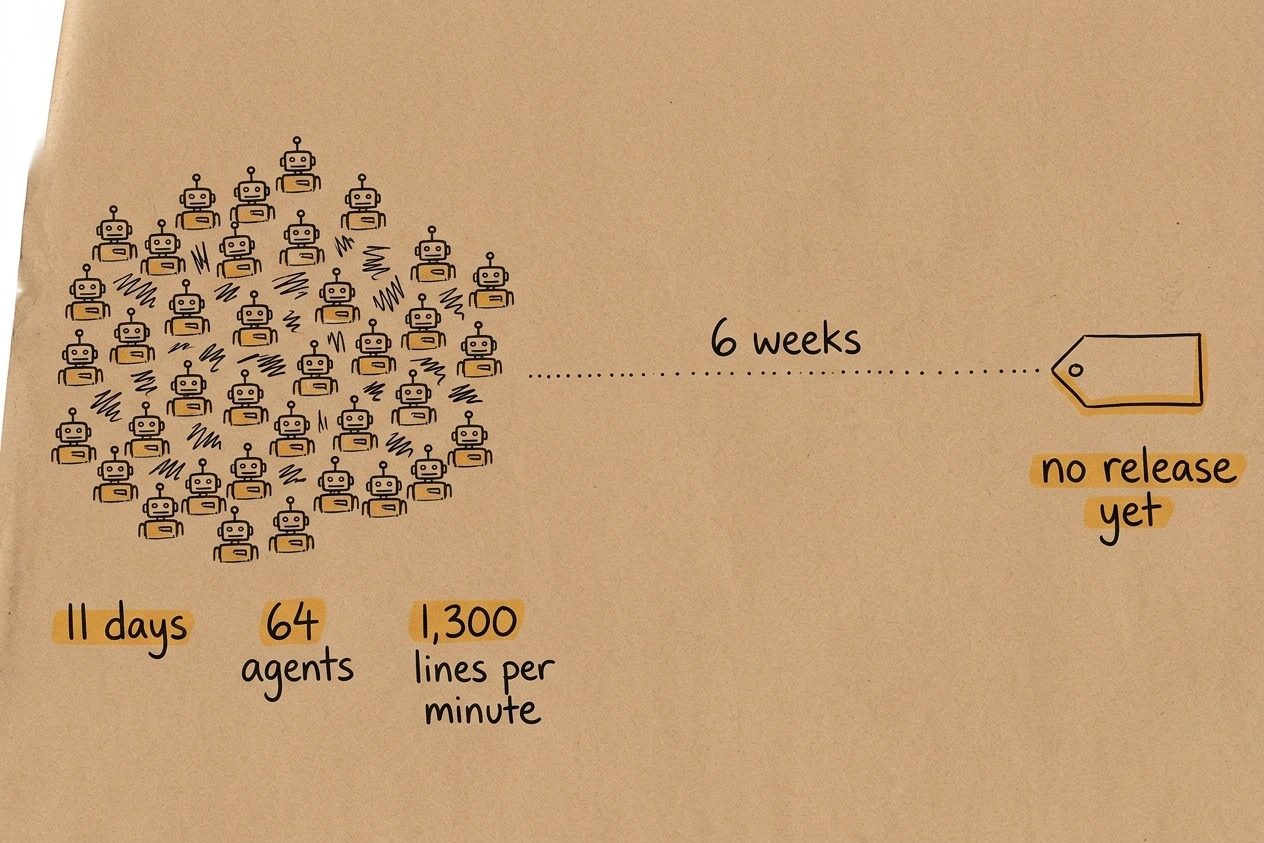
In May 2026, Bun's entire runtime moved from Zig to Rust. Not a module, not a subsystem, the whole thing, done by a fleet of Claude agents over eleven days, May 3rd through the 14th. Bun's own account puts it at "about 50 dynamic workflows," peaking at 64 agents running in parallel and producing roughly 1,300 lines of code per minute. The estimated API cost was $165,000, which Bun frames as roughly equivalent to three engineers working with full context for about a year.
The code merged to main in mid-May. As of this week, six weeks later, there is still no tagged release containing it. GitHub's release history shows bun-v1.3.14, published May 13th, as the newest tag. Bun founder Jarred Sumner explained the gap directly on Hacker News, writing, "The release is delayed until it is true. The PRs to make it true are up but not merged yet." He was referring to a Node.js test-compatibility number promised in the rewrite announcement that had not yet been reached. In the same thread he added that the Rust build has been running quietly inside Claude Code itself for over a month, "and barely anyone noticed."
That is the part worth sitting with before trusting any specific number. The memory claims being discussed right now describe code that has real production mileage inside one specific application, and zero public releases anyone else can install.
The scope of the rewrite is worth naming too. Bun's blog claims 99.8% test compatibility on Linux x64 glibc for the Rust port against the old Zig behavior, plus a roughly 20% binary size reduction on Linux and Windows from the rewrite combined with separate ICU and identical-code-folding work. That last part is exactly what later becomes contested. Whether that binary-size work belongs to "the rewrite" or would have happened anyway is one of the specific things Andrew Kelley disputes, further down.
Method#
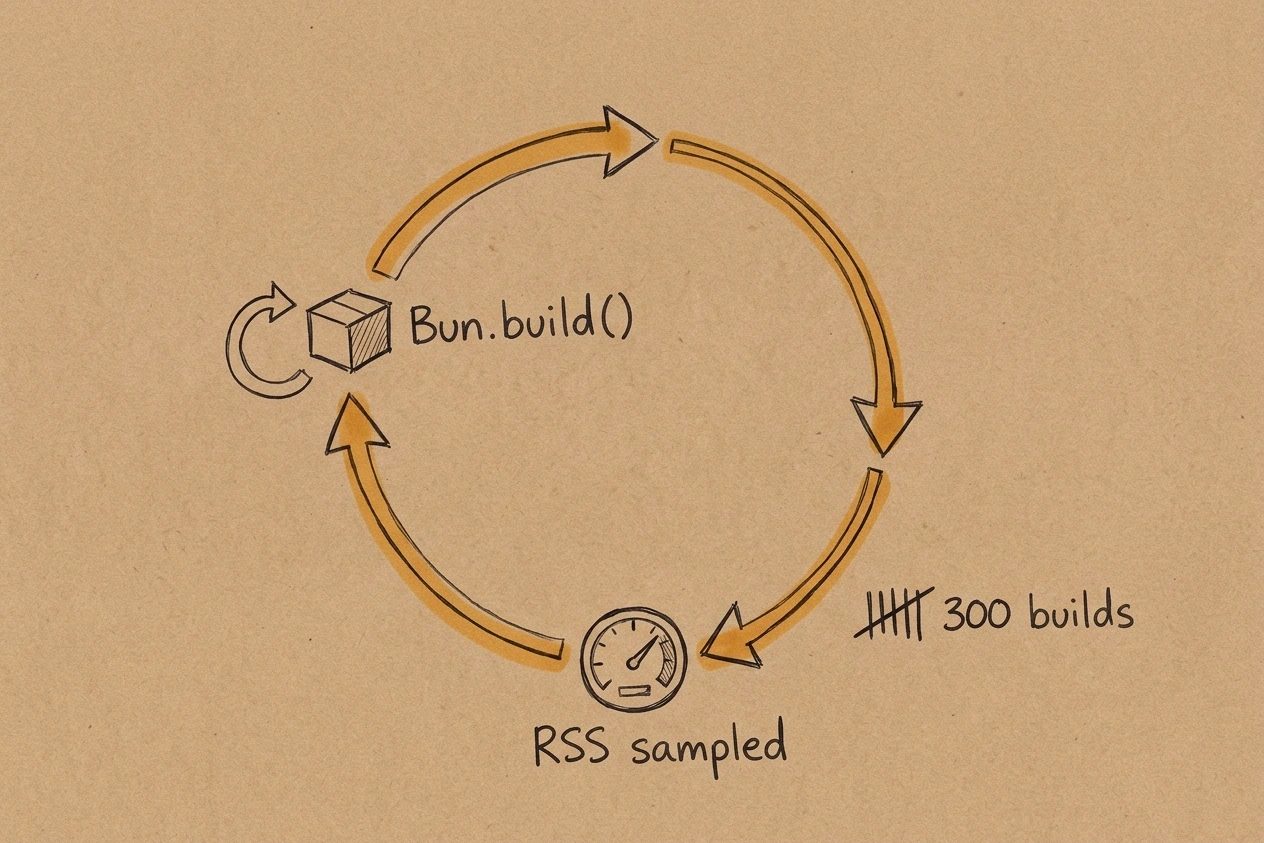
One claim is checkable today regardless of the release status, Bun's own description of the bug the rewrite fixed. The blog states plainly that the old build pathPATHThe shell environment variable listing directories searched in order when a command name is typed, so every lookup walks each entry until one matches.See also WSLENV, appendWindowsPath, command lookup "leaks about 3 MB, forever" on every call to Bun.build(), and that 2,000 repeated builds pushed memory to 6,745 MB before the rewrite and 609 MB after.
That claim doesn't require an unreleased binary to test. Bun.build() is a public API, and the leak, if it behaves the way Bun describes it, should show up in any long-lived process that calls it repeatedly.
for (let i = 1; i <= iterations; i++) {
  const result = await Bun.build({ entrypoints: [entry], target: "bun" });
  if (i % sampleEvery === 0) {
    Bun.gc(true);
    console.log(`after ${i} builds: ${rssMB()} MB`);
  }
}
Two entrypoints, two Bun versions. A trivial three-line file ran through 1,000 builds. A real 281-line script from a working repo, with actual npm dependencies, ran through 300 builds on both Bun 1.3.13 (the currently installed stable release) and Bun 1.3.14 (the exact patch version Bun's own post benchmarks, downloaded in isolation to match it exactly). RSS was sampled after forcing garbage collection, every 25 to 100 builds.
Bun's own benchmark methodology, what it measured RSS with, what the 2,000-build entrypoint actually was, isn't published anywhere. This reproduction is directionally comparable, not methodology-identical, and that gap is worth naming rather than papering over.
A real script matters here more than a synthetic one. The trivial three-line file tells a reader almost nothing about how memory behaves once real dependencies and a real module graph are in the loop, and Bun.build() doesn't type-check by default, it transpiles and bundles, so a bigger module graph is the variable that actually matters here. scripts/publish.ts pulls in a Postgres client and several other packages this repo actually ships with, which is closer to what a working projectProjectsA Claude Desktop feature giving a persistent workspace its own chat history and knowledge base, so uploaded documents and instructions carry into every chat inside it.See also Artifacts, Quick Entry's build step looks like than an empty file ever could be.
The claimed leak does not reproduce#
Read those bars as a rate check, not a raw-total one. Bun's own figures run to 2,000 builds; this reproduction stopped at 300. The comparison that matters is how fast memory climbed, not which bar is taller.
The trivial file showed nothing worth calling a leak. RSS climbed from 39.3 MB to about 64 MB in the first 200 builds, then flattened, even dipping slightly through build 1,000.
The real script told a more interesting story, and told the same story twice. On Bun 1.3.13, RSS jumped to 178 MB by build 25 (module-graph warmup, the interpreter and bundler paying their one-time setup cost) and then climbed slowly to 241.6 MB by build 300. On Bun 1.3.14, the exact version Bun's blog tested, the shape matched almost exactly, 163.6 MB by build 25 and 224.0 MB by build 300. Two different patch versions, the same growth curve.
Neither number comes close to Bun's own figures. A fixed 3 MB-per-build leak, sustained across 300 builds, would add roughly 900 MB on top of the warmup cost. What actually showed up was closer to 60-65 MB of growth after warmup, spread unevenly, not linearly, across 275 builds. Getting from that rate to Bun's reported 6,745 MB at 2,000 builds would need something like a 13x jump in growth rate that these two runs give no evidence for.
None of this refutes Bun's number. The benchmark almost certainly bundles something with a much larger module graph than a 281-line script, and a leak's size plausibly scales with graph complexity in ways Bun's post doesn't specify. What it does mean is that the widely repeated "leaks 3 MB per build, forever" framing isn't what shows up in a build loop sized the way a solo developer's actually runs.
These numbers cannot be checked yet#

The leak fix is one claim among several, and it happens to be the one claim this reproduction could actually test. Two others cannot be, not by anyone outside Bun, not yet.
Bun's blog states that "Bun 1.4 uses up to 32% less memory than 1.3, across every server, every build, and every install," alongside throughput gains in the 2-5% range (Bun.serve up 4.8%, fastify up 4.8%, tsc up 4.7%, next build up 4.5%). Both figures describe the 1.4 line specifically, and 1.4 has not shipped. Sumner's own Hacker News comment confirms the release is still pending on a compatibility number that "is not true yet." Until a tagged 1.4 build exists, nobody can install it, benchmark it, or compare it against 1.3 themselves. The claim sits in the same place it started, stated once by the party with every incentive to state it favorably, unconfirmable by anyone else.
That's not an accusation. It's a description of where the verification chain currently ends.
The independent confirmation was not independent#

The rewrite got real outside coverage, and some of it reads like a second opinion. It mostly isn't. Simon Willison's write-up on the rewrite, fetched directly for this post, attributes every number in it, the token counts, the cost estimate, the 10% faster Linux startup, to Bun's own announcement. He calls it "a detailed description of an extremely sophisticated piece of agentic engineering" and frames the whole undertaking against Joel Spolsky's old warning about never rewriting from scratch. That's a genuinely useful frame. It is not a second measurement.
This matters beyond one blog post. A number that gets repeated across five outlets can look like it has been independently confirmed five times, when in fact it has one source and four relays. Auditing eight months of AI-generated code turned up the same pattern in a different context. A claim can sound corroborated because it's everywhere, and not be, because everywhere traces back to one place.
The cost estimate checks out#
The one figure that does hold up under an independent check is the dollar amount. Bun's blog reports 5.9 billion uncached input tokens, 690 million output tokens, and 72 billion cached inputcache readA token served from a prior prompt's cached context instead of being processed fresh, billed at a fraction of the base input price. Most tokens in a long agent session are cache reads, not new context.See also JSONL, TTL, billed iteration token reads for the rewrite, at "around $165,000 at API pricing."
Running those counts against public Claude Fable 5 API pricing, $10 per million standard input tokens, $50 per million output, $1 per million cached-read tokens, produces a specific number rather than a vibe check.
- 5,900 x $10 = $59,000 for uncached input
- 690 x $50 = $34,500 for output
- 72,000 x $1 = $72,000 for cached reads
- $165,500 total
That lands within rounding distance of the claimed $165,000. It's a small thing to verify, and it's the rare claim in this whole story that a reader can check with a calculator and public pricing instead of trusting anyone's word.
The dispute is about attribution#

Zig's creator, Andrew Kelley, published a public response to the rewrite that has nothing to do with memory numbers and everything to do with how the old codebase got there. His sharpest line calls it "1 million lines of unreviewed slop." He also questioned Bun's own stated rationale head-on, asking, "Then why are you saying you have so many annoying bugs in the Zig code? What happened to the test suite being sufficient to catch everything?"
Kelley's most specific charge is about credit, not code quality. Bun's blog describes a batch of engineering work, cutting binary size, tuning memory, that shipped alongside the rewrite. Kelley's response argues "all that engineering work had nothing to do with the rewrite... you were doing the engineering work that you should have done in the Zig codebase since the beginning." His argument is that some of what's being credited to "the Rust rewrite" was ordinary engineering that was always available, just not done.
Bun's own account of its process claims something specific in the other direction. It describes an "adversarial review" step, separate Claude instances reviewing the generated code assuming it was wrong, that caught concrete bugs before merge. Bun documents three specific catches from that step, including a use-after-free and a panic condition, as evidence the process worked as intended rather than rubber-stamping generated code. Both things can be true at once. A process can catch real bugs and still deserve the criticism Kelley is making about what gets credited to it. Neither one changes what the memory numbers actually measured, which is the separate question this post opened with.
Limits#
- Bun's own benchmark methodology for the leak claim isn't published, so this is a directional reproduction, not a methodology-identical one.
- Bun 1.4's headline numbers, the 32% memory figure and the 2-5% throughput gains, cannot be independently tested by anyone until a tagged release exists.
- Two figures that circulated this week, a "5x lower idle CPU" claim and a separate "10% faster Linux startup" claim, could not be traced to a primary Bun source independently of Willison's relay, and are left out rather than repeated on secondary authority.
- This reproduction ran on Linux under WSL2, not the exact hardware or OS Bun's own benchmark used.
- Forcing garbage collection before each sample (
Bun.gc(true)) changes the number reported at that instant. It was applied identically across every run here, but Bun's post does not say whether its own 2,000-build number was taken with or without a forced collection, so the two numbers are not guaranteed to mean the same thing at the same moment.
Verdict#
One claim in this whole story was independently testable today, and it partly held up and partly didn't. The real script did show persistent RSS growth after warmup on both Bun versions, this reproduction cannot say that growth is specifically the leak Bun describes rather than allocator or cache behavior it doesn't release, but it can say the growth never came close to the fixed 3 MB-per-build magnitude Bun's own number implies at solo-developer scale. The rest of the headline numbers aren't wrong so much as unverifiable right now, sitting behind a release that keeps slipping.
The practical move for a reader deciding whether to repeat any of this is small. Cite the growth result with its actual scope, real but far smaller than advertised at this scale, hold the 32% and the throughput numbers as marketing until a tagged 1.4 build exists somewhere a reader can install, and check whether any future "confirmation" measured anything or just repeated a number well.