
Claude Code vs Codex Limits, Measured in the Same Unit
July 28, 2026
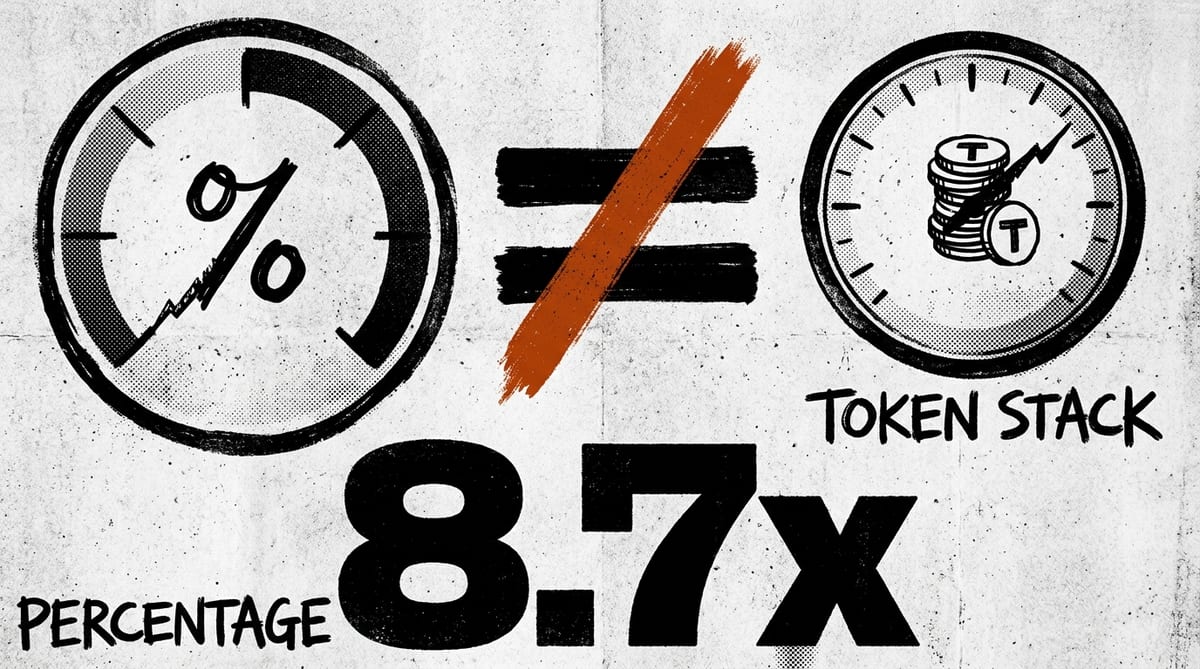
Comparing Claude Code limits against Codex limits looks like an arithmetic problem. Count the tokens each one burns, divide by what the plan costs, pick the winner. That is the search everyone runs and nobody has answered, so this post ran the measurement across 28 days of real work and found the arithmetic does not close.
What each tool writes to disk#
Two different things end up on disk
The two tools do not record the same thing, and that asymmetry decides everything downstream. Claude Code writes a .jsonl transcript per session under ~/.claude/projects, one line per event, with a usage object on assistant messages. Codex writes a rollout .jsonl under ~/.codex/sessions carrying cumulative session totals plus something Claude Code never records at all.
That something is the quota reading.
{
  "total_token_usage": {
    "input_tokens": 2731312,
    "cached_input_tokens": 2620160,
    "output_tokens": 14475,
    "reasoning_output_tokens": 7180,
    "total_tokens": 2745787
  },
  "rate_limits": {
    "primary": {
      "used_percent": 37.0,
      "window_minutes": 10080,
      "resets_at": 1785400064
    }
  }
}
Codex hands you used_percent against a 10080 minute window, which is seven days, and the timestamp it resets. Claude Code hands you token counts and nothing else. A search across 6,671 transcript files turned up zero quota fields of any kind.
Reading Claude plan utilization takes a live network call instead. The /usage command in v2.1.174 and later hits an undocumented OAuth endpoint and draws plan bars from the response, which is the only way to see it and is not derivable from anything on disk. That is worth knowing before you go looking for a field that was never written.
The dataset behind this post came from parsing both trees. Twenty eight days of Claude Code, 6,671 files, 959,504 lines, 308,641 assistant messages carrying usage, and no parse failures. The Codex side is thinner and that matters later.
import { readFileSync } from 'fs';

// Claude Code writes one JSON object per line.
// Only assistant messages carry a usage object.
const totals = { input: 0, output: 0, cacheWrite: 0, cacheRead: 0 };

for (const line of readFileSync(file, 'utf8').split('\n')) {
  if (!line || line[0] !== '{') continue;
  const evt = JSON.parse(line);
  const u = evt?.message?.usage;
  if (!u) continue;
  totals.input += u.input_tokens ?? 0;
  totals.output += u.output_tokens ?? 0;
  totals.cacheWrite += u.cache_creation_input_tokens ?? 0;
  totals.cacheRead += u.cache_read_input_tokens ?? 0;
}
Across the full window that came to 56.8 billion tokens. Priced at Anthropic's published rates it works out to roughly 48,900 dollars of API-equivalent consumption on a subscription, about 12,200 dollars a week. Hold that number loosely, because a later section takes some of it back.
The Codex tree needed a different parser and produced a much smaller pile. Thirty four sessions across four active days, 208.7 million tokens, and 1,917 separate rate-limit records. Cumulative totals per session rather than per-message deltas, so the two sides cannot be summed the same way even before pricing enters the picture.
The same token does not cost the same quota twice#
Here is where the arithmetic breaks. Two consecutive weekly windows on one Codex account, measured from the same logs, consumed quota at wildly different rates per token.
The first window burned 4,381,803 tokens to reach 7 percent. The second burned 200,953,705 tokens to reach 37 percent. Divide it out and one point of quota cost 625,972 tokens in the first window and 5,431,181 in the second, a spread of 8.7x on one account inside a fortnight.
A token is not a unit of quota. It is not even a stable proxy for one.
This is not a local anomaly. A separate account documented in openai/codex issue 28879 saw the rate move by 10 to 20 times inside a single week, with the reporter measuring roughly 57 thousand tokens per percent on one date and 20 thousand tokens for 10 to 27 percent six days later. Two independent accounts, same shape of instability.
So every tool that estimates your remaining limit from a token count is guessing, and the size of the guess is not small. If you have been trying to budget a week of work by counting tokens, that is why the budget keeps missing.
Run the arithmetic forward and the problem gets concrete. A task that costs 2 percent of the week in one window costs a quarter of a percent in another, for identical work. Plan a sprint on the first figure and you finish early with quota to spare, plan it on the second and you are locked out on Thursday.
Codex reports the account, not the session#
Before anyone tries to measure burn by watching used_percent move, there is a trap in the field itself. It reports the whole account at the moment the line was written, not the session doing the writing.
$ node rl-track.mjs | grep 2026-07-24

ts                    used%   delta
16:48:28                  9     +1
16:49:11                  8     -1
16:49:20                  9     +1
16:56:36                 10     +1
17:18:05                 11     +1
17:21:38                 12     +1
17:22:19                 11     -1
17:22:30                 12     +1
That trace is thirty four minutes of real logs and it goes backwards twice. Nine, then eight, then nine again. Later twelve, then eleven, then twelve.
Nothing was refunded. Two sessions were running at once, each writing the account value it last saw, and the older reading landed on disk after the newer one. Diff those numbers naively and you get a burn figure built on staleness.
A second shape shows up in the same logs and catches people the same way. When a fresh session starts it writes out the account history it has just been handed, so eight readings from 1 through 8 land on disk carrying one identical timestamp. Sorted by time they look like a burst of consumption in a single second, and they are nothing of the kind.
Other people have hit the same wall from the other direction. Issue 32129 records one account showing 99 percent and 89 percent on the same seven day window simultaneously, with the reporter noting that account level limits should not show conflicting remaining percentages across sessions. No maintainer has confirmed the behaviour in either thread, so treat this as consistent observation rather than documented specification.
The practical rule is short. Take the maximum reading across a window, never a difference between consecutive readings.
Cache hit ratio is the hidden multiplier#
The 8.7x spread needs an explanation, and cache state is the strongest candidate the data offers. Cached tokens do not cost what fresh ones cost, and the gap is an order of magnitude.
A cache read bills at a tenth of base input. A five minute cache write bills at 1.25 times, and a one hour write at double. Between the cheapest and dearest token in that series sits a factor of twenty.
Now put the measured dataset against it. Of the 56.8 billion tokens in the Claude window, 53.9 billion were cache reads. That is 94.9 percent of everything, all of it billing at the bottom of the scale.
The imbalance is starker as a ratio. Those 53.9 billion cache reads sit against just 104.6 million tokens of uncached input, roughly 515 reads for every fresh token. Almost nothing in a month of heavy agent work is new context.
Codex logs the same shape on its own side, which matters because the 8.7x spread is a Codex number and the pricing table above is Anthropic. Of the 208.7 million tokens in the Codex sample, 200.7 million were cached input, or 96.1 percent. Both tools run overwhelmingly on cache, so cache state is a plausible driver on both.
Plausible is the honest word. Anthropic publishes what a cached token costs and OpenAI does not, so the multiplier that would close the argument on the Codex side is not available to check. The mechanism is inferred from one vendor and applied to the other, which is exactly the kind of step the next section refuses to hide.
Shift that ratio and the cost of identical work moves by an order of magnitude without a single extra prompt. The Claude Code costs documentation makes the mechanism concrete, noting the cache lifetime runs an hour on a subscription and drops to five minutes once usage credits come into play. A change in TTL turns yesterday's reads into today's writes.
That is the same lever from a different angle to how to reduce AI coding tool token usage by 50%. Cutting token count helps. Keeping the cache warm helps more, and the two are not the same move.
The reset date moves without telling you#
One field survives all of this looking trustworthy. resets_at gives a timestamp, the window length is a fixed 10080 minutes, and planning around it feels safe.
It is not safe.
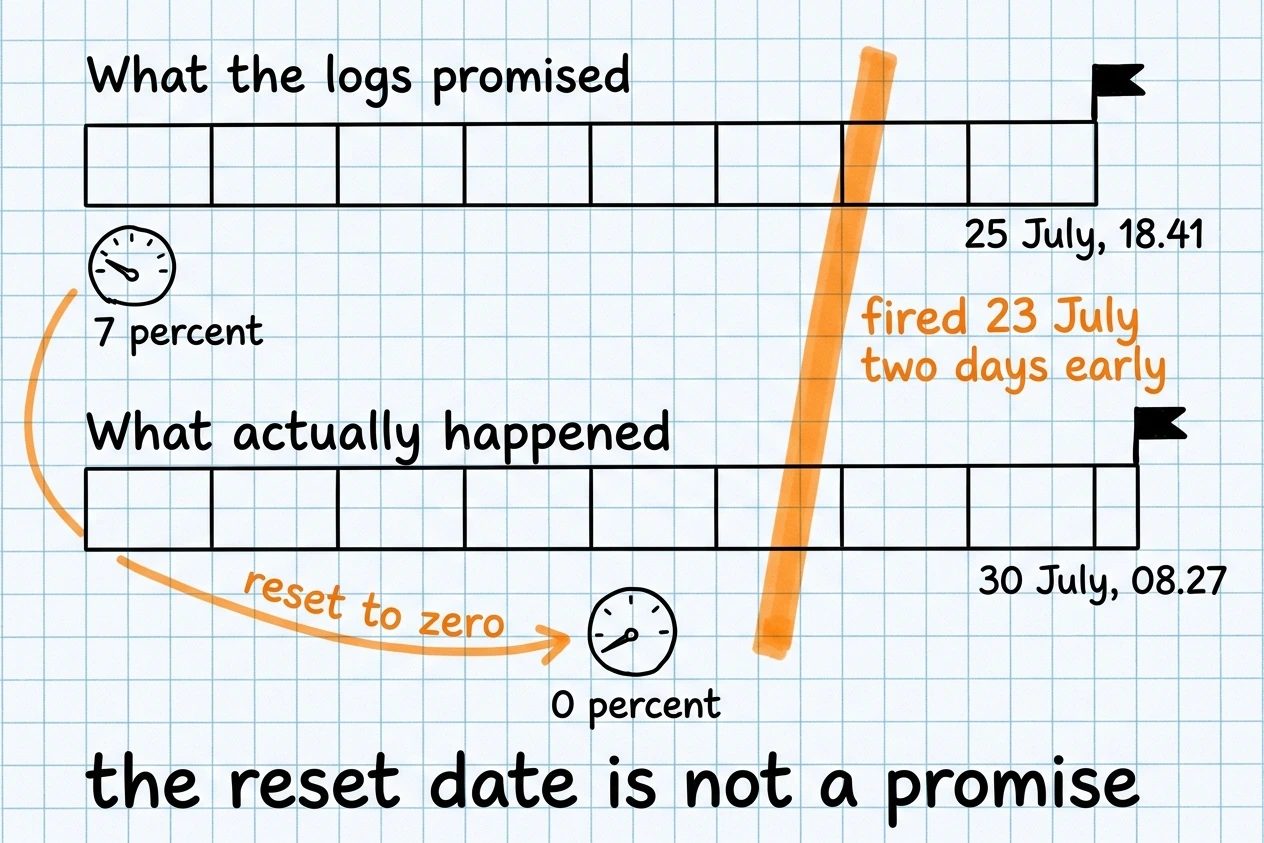
In the measured logs the window re-anchored mid-flight. The reset moved from 25 July at 18.41 UTC to 30 July at 08.27 UTC, and it fired on 23 July at 08.27, roughly 2.2 days before the date the logs had been advertising. Used percent dropped from 7 straight to 0.
The quota came back early, which sounds like a gift until something automated depends on the date. OpenAI has issued unannounced account-wide resets matching this shape, discussed in its own community forum. Any scheduler, dashboard, or batch job that reads resets_at and plans against it will be wrong on those days.
The failure is quiet, which is the worst kind. A job that waits for a reset that already happened simply idles, and a job that fires against a window it thinks is fresh burns into a quota that has not turned over. Neither raises an error, so both look like the tool working normally.
What this measurement does not prove#
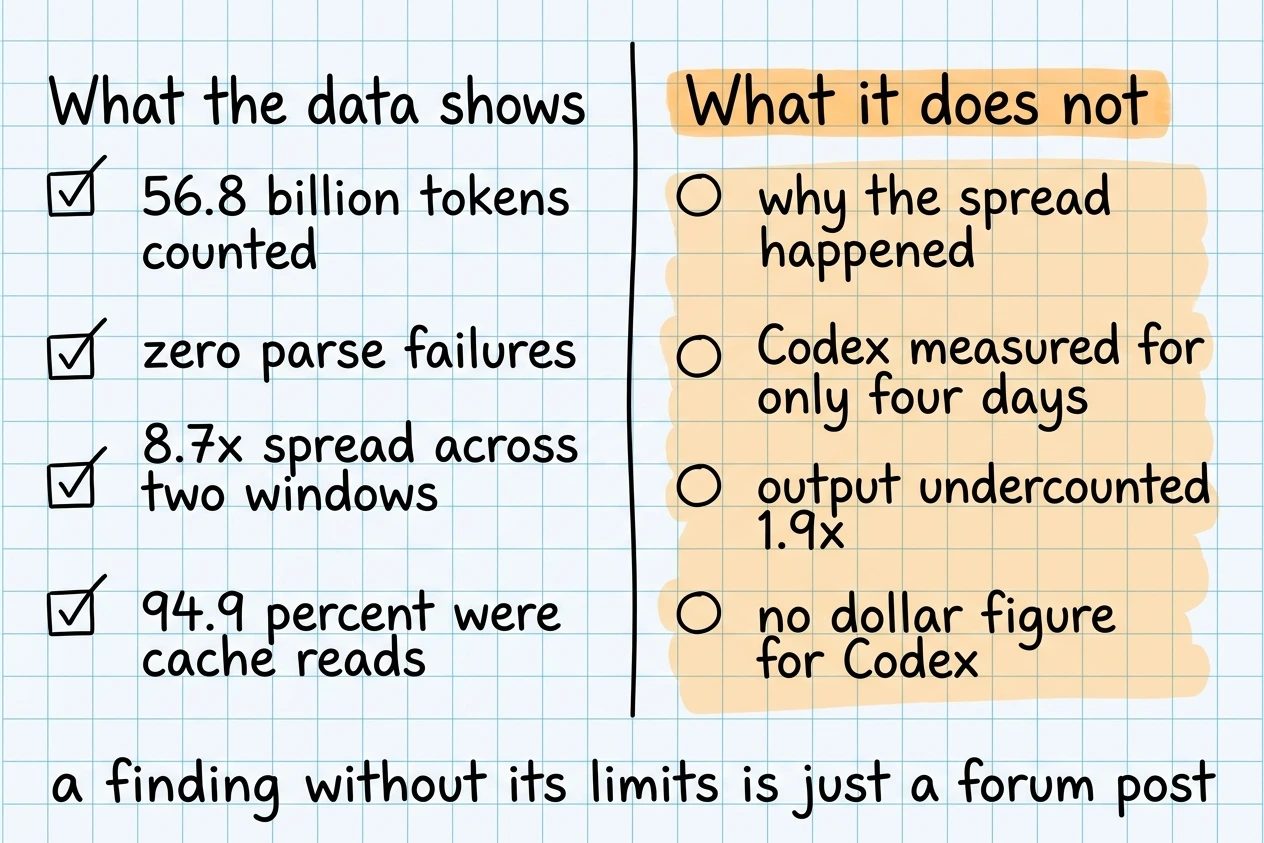
Four things, stated plainly, because a finding without its failure modes is just a forum post with better formatting.
- Thin Codex sample. Thirty four sessions across four active days ending 24 July, against 28 days on the Claude side. Two quota windows is enough to show the spread exists and nowhere near enough to characterise its distribution.
- Cause not isolated. Cache hit ratio correlates and the pricing multipliers make it plausible, but no controlled test separated it from model mix or server-side recalibration. Issue 28879 corroborates that the variability is real while attributing it to an unrelated incident.
- Output undercounted. Claude Code transcript
output_tokensundercounts billable output by about 1.9x because the finalmessage_stopevent is never written, measured at 23,725 against 45,050 on the same content in issue 27361. It is closed as not planned, so the gap is live. - Dollars are illustrative. ccusage already estimates API-equivalent dollars from these transcripts, so that conversion is not new here, and it carries the same 1.9x shortfall on output.
There is also no dollar figure for the Codex side at all, and that is deliberate. OpenAI publishes an API rate card, but it prices API calls rather than subscription consumption, and no published factor converts a percentage of plan quota into money. Inventing one would have made the two columns look comparable while quietly making them fiction.
None of this makes the measurement worthless. It establishes that the spread is real, reproducible off one machine, and large enough to break any token-based budget. What it does not do is tell you the exchange rate for your own account next week, and no method available today can.
Which is the finding underneath the finding. No published tool converts both vendors into one normalized unit, and the person who came closest, a script that pulls Claude, Codex and Gemini quotas into a single file, calls cross-vendor comparison mathematically impossible without normalization.
The short version#
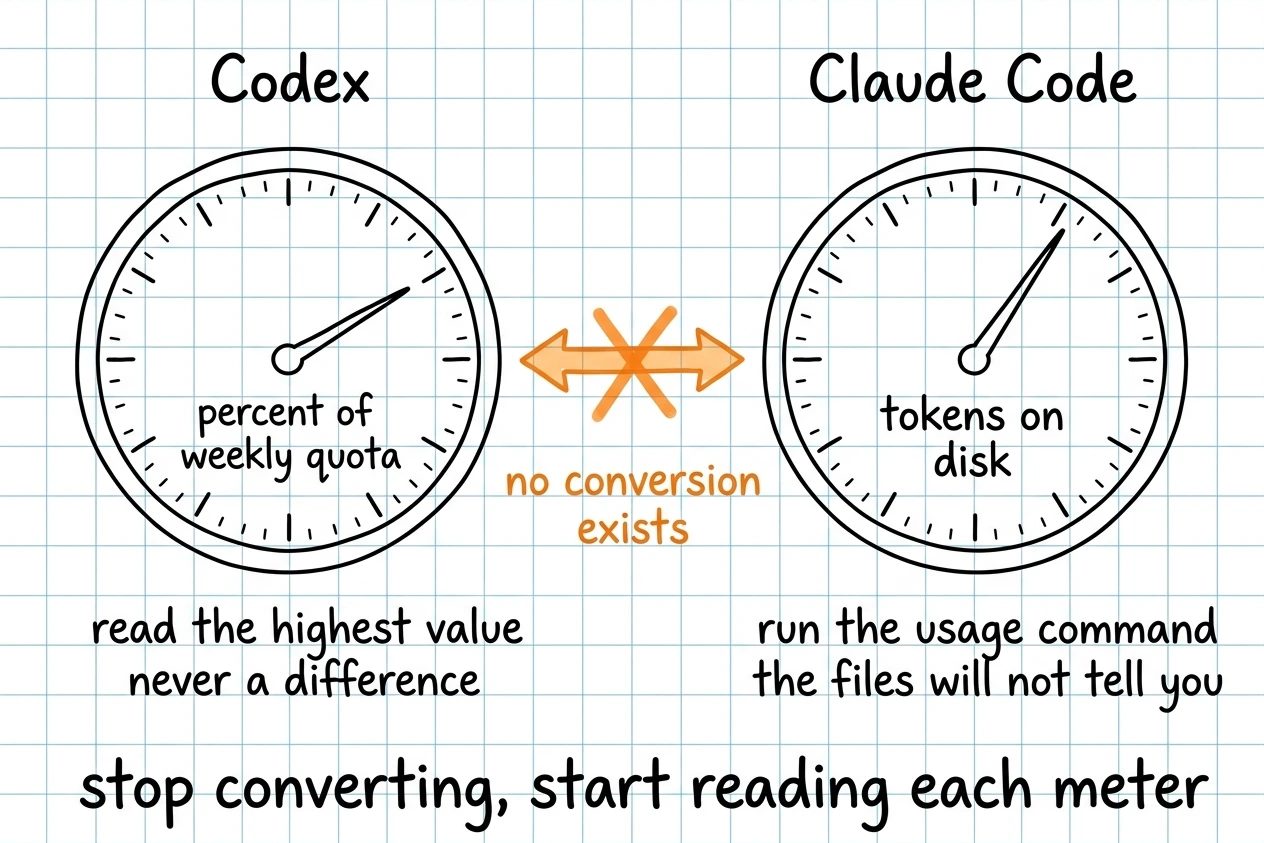
The comparison the search query wants cannot be answered as asked. There is no same unit, because one vendor publishes a percentage and no price, the other publishes a price and no percentage, and the exchange rate between tokens and quota moved 8.7x on one account in two weeks.
What is left is one honest instrument on each side.
- On Codex, read the highest
used_percentin a window and never a difference between two readings. - On Claude Code, run
/usageand read the plan bars, because the transcripts will never tell you.
Anything built on top of that should treat both numbers as observations rather than contracts. The endpoint behind /usage is undocumented, so it can change shape without a release note, and the Codex percentage is a reading of an account that other sessions are moving underneath you. Sample them often, keep the maximum, and never persist a derived remaining-budget figure as if it were a fact.
Then stop optimising token count and start watching cache state. It is the variable with an order of magnitude behind it, and it is the one most people are not looking at while they trim prompts.
The decision between the two plans turns on how your work sits against that. Long sessions on a stable context stay cached and get enormous value out of a subscription, which is what 94.9 percent cache reads across 28 days actually describes, while short scattered sessions that rebuild context every time pay the write multiplier again and again. For that second shape the metered API is the more honest instrument.
The complaint that Claude usage limits are a bigger problem than Anthropic admits is real. The limits are less arbitrary than they feel once you can see which of those two shapes you are in.