
IntelliJ MCP router-only keeps agent tools off the prompt
August 25, 2026

IntelliJ MCP in 2026.2 can hide the debugger catalog behind one execute_tool. Router-only is the switch. A debug step still works after the skill loads.
The shared MCP server is a coat check that hung every coat on the counter. xdebug_start_debugger_session, xdebug_set_breakpoint, xdebug_control_session, plus analyze_calls and the rest of the IDE catalog, all sitting in the prompt whether anyone is debugging or not. JetBrains' agentic debugging help says those descriptions are part of the agent context at all times.
You'll feel it on a long Claude Code sitting. The model spends tokens reading tool cards it never calls.
Building an MCP server from scratch is the other job. This one is IntelliJ collapsing its own catalog so an external client stops eating it.
What has to be sitting there already#
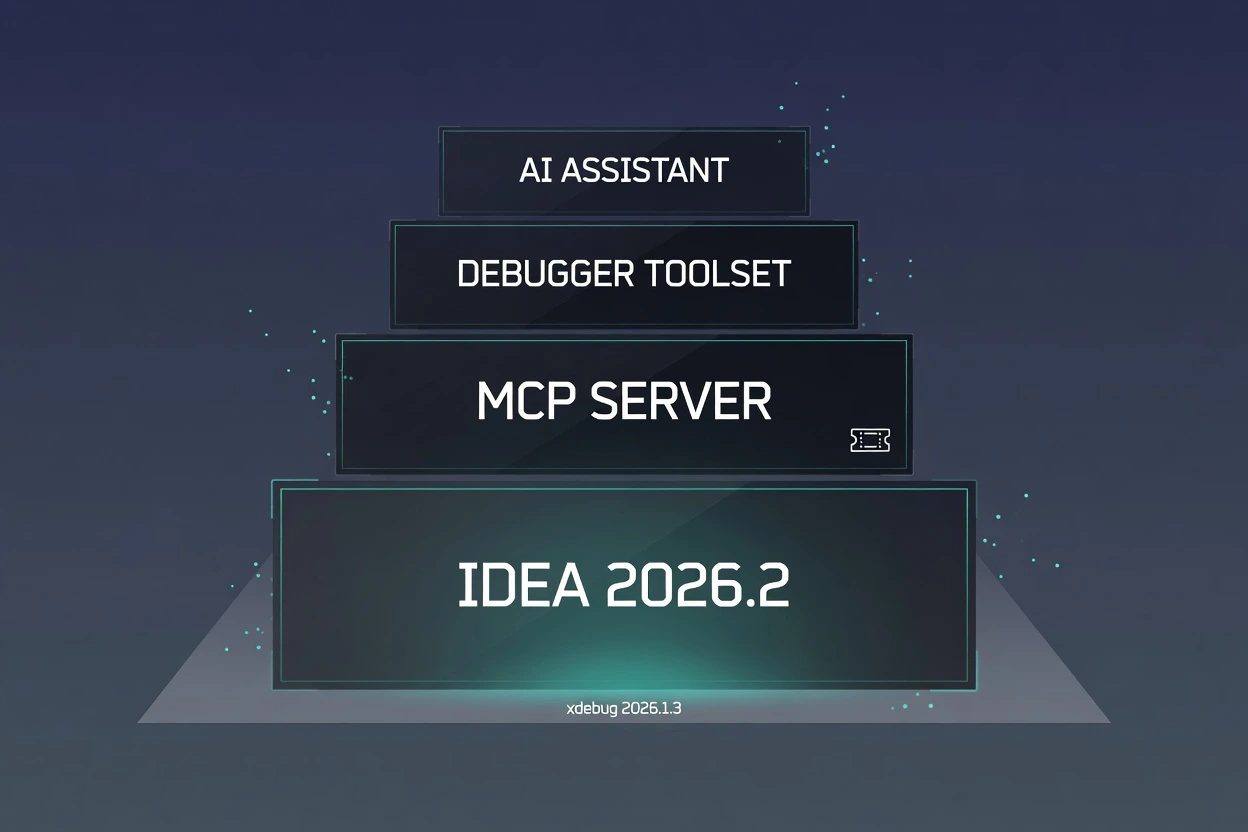
Pin 2026.2. Router mode is a 2026.2 feature. The xdebug_ tools showed up in 2026.1.3. An older IDE can serve the flood and cannot hide it.
The MCP Server plugin is bundled and on by default. So is Debugger MCP Toolset. If Exposed Tools is empty, those two checkboxes in Plugins are the first place to look. The ij-debugger skill needs the AI Assistant plugin as well.
- IntelliJ IDEA 2026.2 or later
- MCP Server plugin enabled
- Debugger MCP Toolset plugin enabled
- AI Assistant plugin enabled if the skill install is in this run
- An external client. Claude Code or Codex for the full router-only plus skill path. VS Code can still auto-configure as a client of the server.
JetBrains' MCP Server docs name Claude Code, Codex, VS Code, Junie, Air, and GitHub Copilot CLI for auto-configure. Router mode's own page names Claude Code and Codex. VS Code can still attach to the server. The skill install and debug-step proofs below are only documented for Claude Code and Codex.
Hide the tool wall#

Two controls live on the same page, and ticking the small one is how people fake the job. Per-tool Router-only hides that one tool. Enable router-only mode is the actual collapse. Use All agents unless ACP-only is a conscious choice.
1. Enable the MCP server#
Open Settings, then Tools, then MCP Server. Check Enable MCP Server. The confirm dialog lists what third-party apps will see in workspaces currently open in the IDE. Enable, then Apply.
Checkpoint. The checkbox stays on after you leave the page.
2. Auto-configure the client#
Same settings page, Clients Auto-Configuration. Hit Auto-Configure for Claude Code or Codex. VS Code is on that list if you only need the server attached. That writes the IDE address into the client's config. Restart the client. Skipping the restart is the classic empty-tools ghost.
Project-level auto-configure exists if you do not want every session on this machine to see the server. Use that when several repos are open and only one should be reachable.
3. Look at Exposed Tools before the switch#
Open Settings, Tools, MCP Server, Exposed Tools. Before router-only, the list is the flood. Debugger entries are the xdebug_ family. Analysis sits next to them. analyze_calls, build_project, execute_terminal_command, the file tools, the lot.
Leave this page open. The before-shot is the only honest proof the after-shot changed anything.
4. Turn on router-only mode#
On Exposed Tools, turn on Enable router-only mode. Scope it to All agents unless the client is ACP-only on purpose. Apply.
Per-tool Router-only checkboxes are the fine grain. They hide a tool from the direct list and leave it reachable through the router. They do not replace the mode switch. A few ticks and a still-off mode still ships the rest of the wall.
JetBrains' MCP Server docs say that when a tool is only available through the router, you describe it in a skill so the agent knows to call it. The next section is that skill.
5. Restart the client and list tools#
Restart Claude Code or Codex. Ask the client to list MCP tools from IntelliJ.
Checkpoint. The client lists execute_tool. The xdebug_ wall is gone from the direct list. If the wall is still there, the mode did not apply to that client, or the process is still the pre-Apply one.
xdebug_start_debugger_sessionandxdebug_get_debugger_statusxdebug_list_breakpoints,xdebug_set_breakpoint,xdebug_remove_breakpoint,xdebug_run_to_linexdebug_control_sessionfor step, resume, pause, stopxdebug_get_frame_values,xdebug_evaluate_expression,xdebug_get_threads
Those names should vanish from the direct list. They stay reachable as commands on execute_tool after the skill loads.
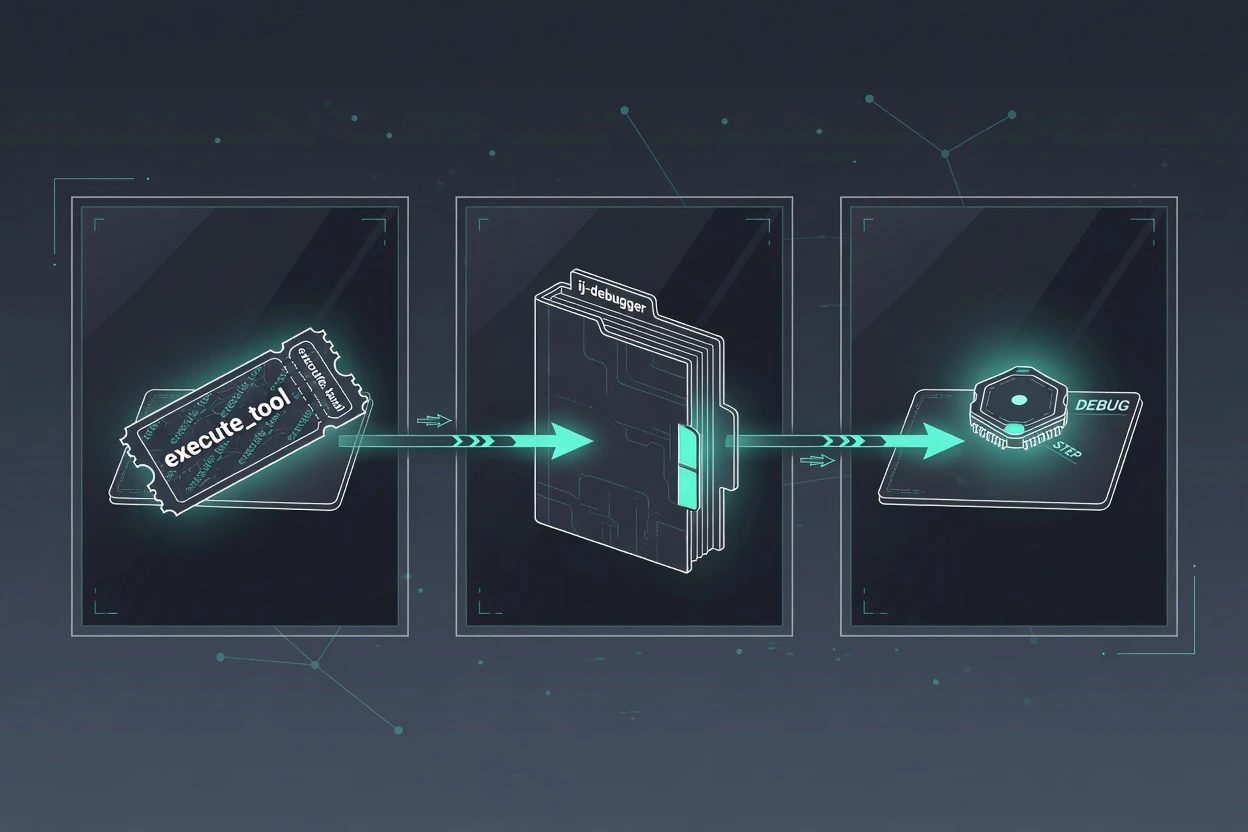
execute_tool takes a command-line string. Tool name, then arguments. The MCP Server docs call it the universal tool executor. The debugger names from the old list become commands on that one tool, not peer tools in the prompt.
Put the debugger back#
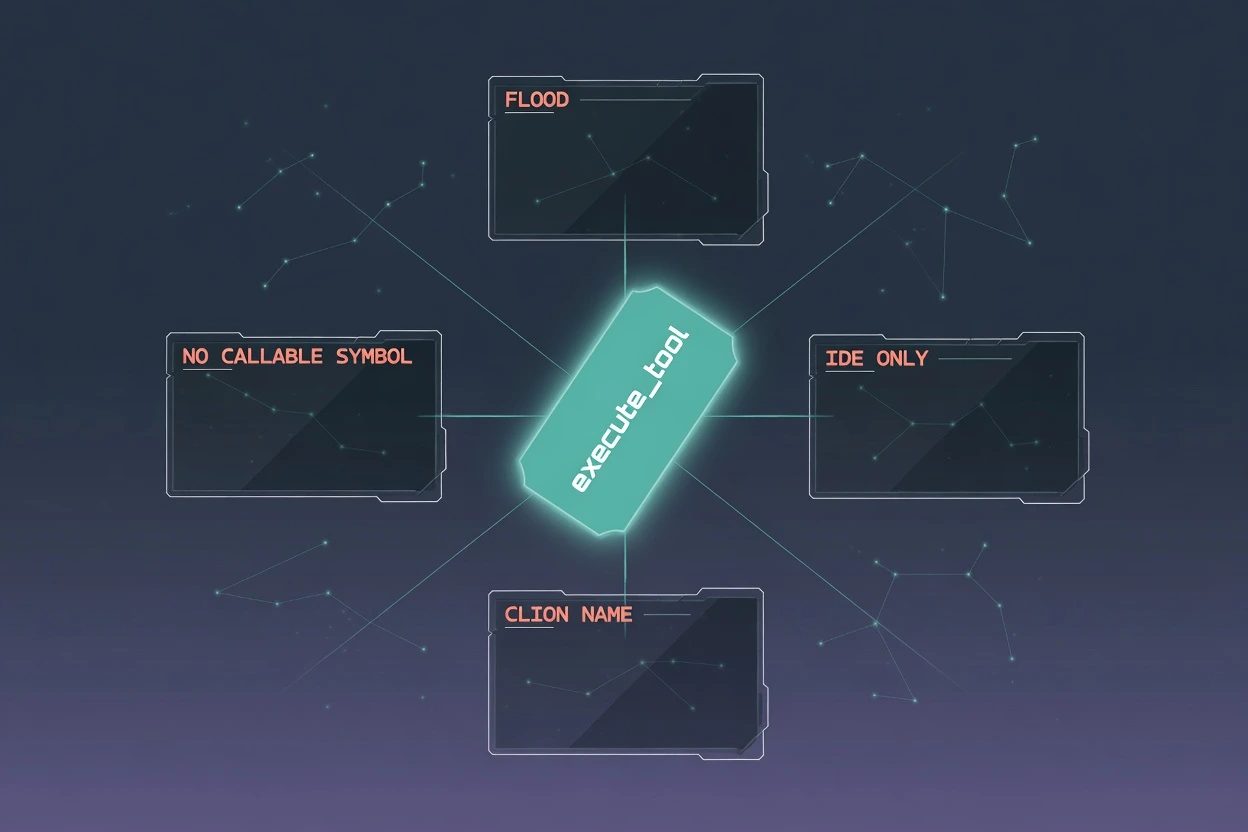
Hiding the catalog is only half the job. The agent now sees one tool and no playbook. The ij-debugger skill is that playbook, and JetBrains tells you to put router tools in a skill so the agent knows when to call them.
6. Install ij-debugger for Claude Code or Codex#
Open Settings, Tools, AI Assistant, Skills. Bundled skills. Find ij-debugger. It is already on. That on-switch is for agents inside the IDE.
Claude Code or Codex outside the IDE needs a Global install. Use Claude Agent (Global) or Codex (Global). The skill copies into a folder the client already watches.
ls ~/.claude/skills/ij-debugger/
ls ~/.codex/skills/ij-debugger/
Checkpoint. One of those directories exists and is not empty. Windows uses %USERPROFILE%\.claude\skills\ij-debugger\ and the Codex twin under .codex. Writing skills so they actually trigger is the same shape. A bundled skill with no folder on disk is a setting that never left the IDE.
Watch the name. IntelliJ's turn-on steps still say clion-debugger in one paragraph, copied from CLion. The architecture section, the Skills page, and the folders all say ij-debugger. Search for the IntelliJ name.
7. Take a debug step through execute_tool#
In the external client, invoke /ij-debugger or ask it to start a debug session, set a breakpoint, and step. The skill should load, then the client should call execute_tool with an xdebug_ command, not a native xdebug_ tool.
Checkpoint. The Debug tool window in IntelliJ shows a session. A step lands. You can take over from that window at any point. If the client lists xdebug_control_session as its own tool again, router-only is off or the client never restarted.
When it breaks#
The official walkthrough is Enable, Auto-Configure, tick the mode. The failures are the reason this post exists.
The wall comes back mid-session#
Router-only was off, or scoped to ACP agents only while Claude Code is not ACP. Or Exposed Tools still has debugger rows Enabled and not Router-only, with the mode switch itself off. Re-open Exposed Tools. Confirm Enable router-only mode is on for All agents. Restart the client again. Long sessions without the mode will keep paying for xdebug_ descriptions on every turn, which is the thing JetBrains' help says router mode is for.
execute_tool sits there unused#
The skill stayed inside the IDE. Claude Code has execute_tool and no idea what commands exist. Install Global. Confirm the folder. Then /ij-debugger. The docs already tell you to put the playbook in a skill.
A 2026.2 MCP gap that is not the switch#
analyze_calls on PHP or C# can return No callable symbol found for every symbolFqn. That is a documented 2026.2 MCP resolver gap, not router-only failing. JetBrains' MCP tools KB says search_symbol and Call Hierarchy inside the IDE still work. Use those. It does not put the debugger wall back on the prompt.
Router-only questions the settings page buries
I ticked Router-only on a few tools. Why does Claude Code still list the debugger catalog?
The per-tool checkbox hides only those tools. The mode that actually collapses the list is Enable router-only mode, scoped to All agents unless ACP-only is the intent. Restart the client after Apply. A half-ticked Exposed Tools page still ships the rest of the catalog into the prompt.
asked on jetbrains.com ↗The ij-debugger skill is enabled. Why does Claude Code outside the IDE ignore it?
Enabled by default means Junie and the in-IDE agents can see it. Claude Code and Codex outside the IDE need an explicit Global install from Settings, Tools, AI Assistant, Skills. After that the folder is ~/.claude/skills/ij-debugger/ or ~/.codex/skills/ij-debugger/. Invoke /ij-debugger or let it fire when you ask for a debug step.
asked on jetbrains.com ↗analyze_calls says No callable symbol found on PHP. Is the project index broken?
The index is fine. JetBrains documents a 2026.2 MCP gap. Every PHP and C# symbolFqn form returns that error, while JavaScript in the same session, search_symbol, get_symbol_info, and Call Hierarchy inside the IDE still work. Find the symbol with search_symbol, then search_text or search_regex for call sites. Text search will not tell two same-named methods apart.
asked on youtrack.jetbrains.com ↗The help page says clion-debugger. Which skill do you actually install?
Install ij-debugger. The IntelliJ turn-on steps still paste CLion's skill name in one paragraph. The architecture section, the Skills page, and the install folders all say ij-debugger. If Settings search for clion-debugger comes up empty, that leftover is why.
asked on jetbrains.com ↗What now exists#
Settings, Tools, MCP Server, Exposed Tools has Enable router-only mode on. Claude Code or Codex lists execute_tool, not a wall of debugger tools. ~/.claude/skills/ij-debugger/ or the Codex twin is on disk. A debug step still works after the skill loads, and the Debug tool window is the proof.