Chrome inspect devices fails until USB debugging is on
August 25, 2026

The chrome inspect devices page is empty because USB debugging is still off, or Discover USB devices is unchecked, not because Chrome lost the phone. Chrome's remote debugging docs put those two switches first, then a cable, then a prompt. Windows still owes an OEM driver. --remote-debugging-port=9222 is the agent lane, not this one.
A data cable and Developer options#
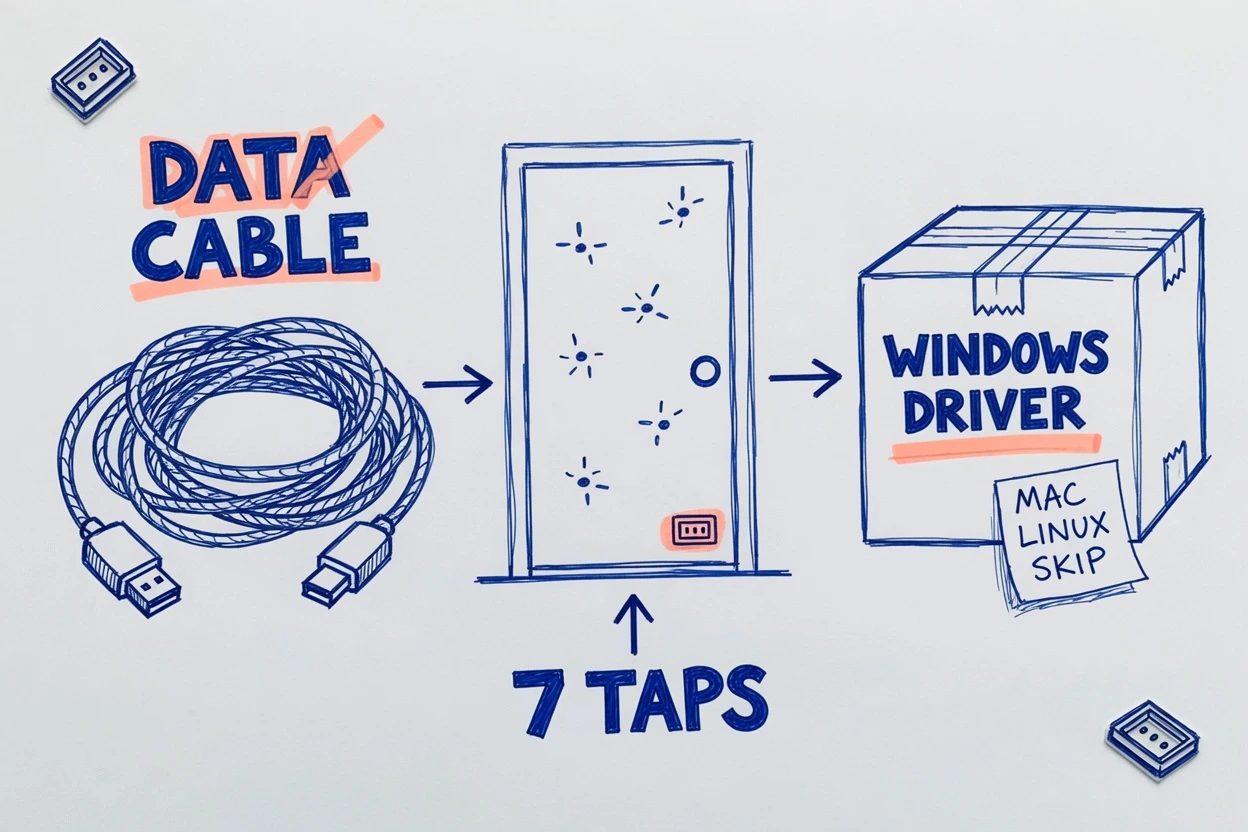
Chrome on the laptop. Chrome for Android on the phone. A USB cable that can actually move files, not the charging-only costume that came in the box. If the laptop cannot browse files on the phone, treat the cable as the first suspect. Chrome's troubleshooting uses file access as the cable check.
Android's developer options page hides that screen on Android 4.2 and higher until Build number is tapped seven times. On a Pixel that lives under Settings, About phone. On a Galaxy S8 or later it is Settings, About phone, Software information, Build number. The toast says you are now a developer.
That screen is the door. USB debugging is the lock on it. A sibling post can fight Samsung's auto blocker. This one assumes Developer options already exists and uses the debugging toggle inside it.
- Chrome on the laptop, Chrome for Android on the phone
- A USB cable that can copy files, not a charge-only lead
- Developer options already unlocked via seven taps on Build number
- On Windows, the OEM USB driver for that phone
Android's OEM USB driver page is blunt about the Windows tax. If the development machine is Windows, install the manufacturer driver. macOS and Linux should not need one. Pixel and Nexus on Windows take Google's USB driver. Samsung ships its own Windows USB driver, named in that table, and Chrome's docs call out Samsung plus Windows as the combo that still needs extra setup.
Turn USB debugging on then open chrome inspect devices#
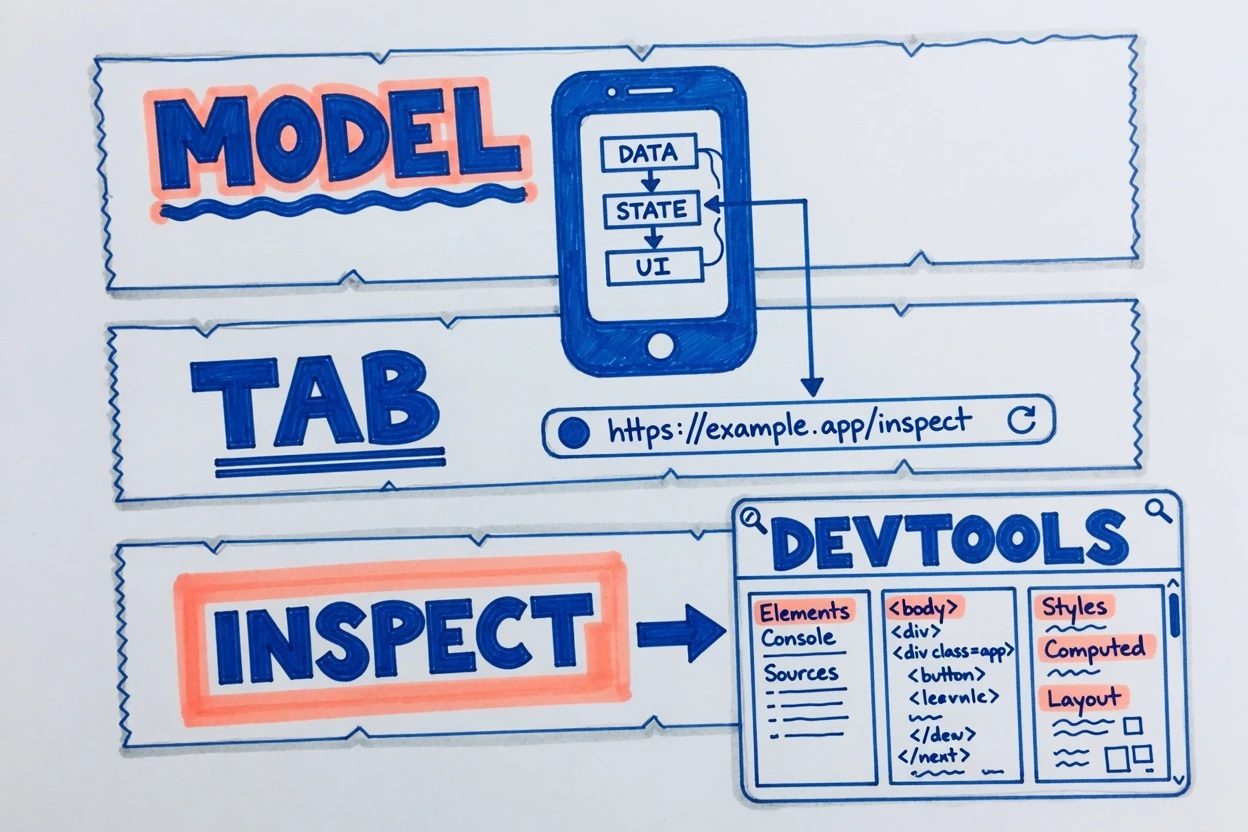
Think of chrome inspect devices as a door with two deadbolts. Phone side is USB debugging. Laptop side is Discover USB devices. Leave either one shut and the model name never walks in. People keep jiggling the cable like that will pick the lock.
1. Flip USB debugging on the phone#
On Android 9 and higher the toggle sits at Settings, System, Advanced, Developer options, USB debugging. Android 8 parks it under Settings, System, Developer options. Wear OS 6 labels the same idea ADB debugging. Turn it on. The phone is now allowed to talk, not yet talking.
You'll hit a second prompt the first time a computer shows up. Allow USB debugging is that RSA allow prompt. Until it is accepted, Chrome's page is allowed to show the device as Offline and pending authentication. That is not a dead cable. That is the phone waiting for a thumb.
2. Check Discover USB devices#
Open Chrome on the laptop. Go to chrome://inspect#devices. Tick Discover USB devices before the cable goes in. Chrome's own screenshot is that checkbox enabled. Skip it and the Devices list stays a blank parking lot even with USB debugging already on.
Keep that tab focused. The Allow prompt on the phone likes an awake laptop screen and an awake home screen. Locked glass on either side is a documented way for the prompt to never appear.
3. Plug in and accept the prompt#
Straight into the machine. Not a hub. Unlock both screens. If this computer has never been trusted, the phone shows Offline pending authentication until Allow USB debugging is tapped. Check Always allow from this computer if this is a desk you actually use.
The proof is the model name. Chrome's docs treat that string as proof the connection landed. Serial number rides next to it. No model name means a switch is still off, the cable is fake, or Windows never got its driver.
A USB hub will lie. Chrome's troubleshooting says to plug the Android device directly into the development machine instead.
Prove chrome inspect devices with an inspect link#
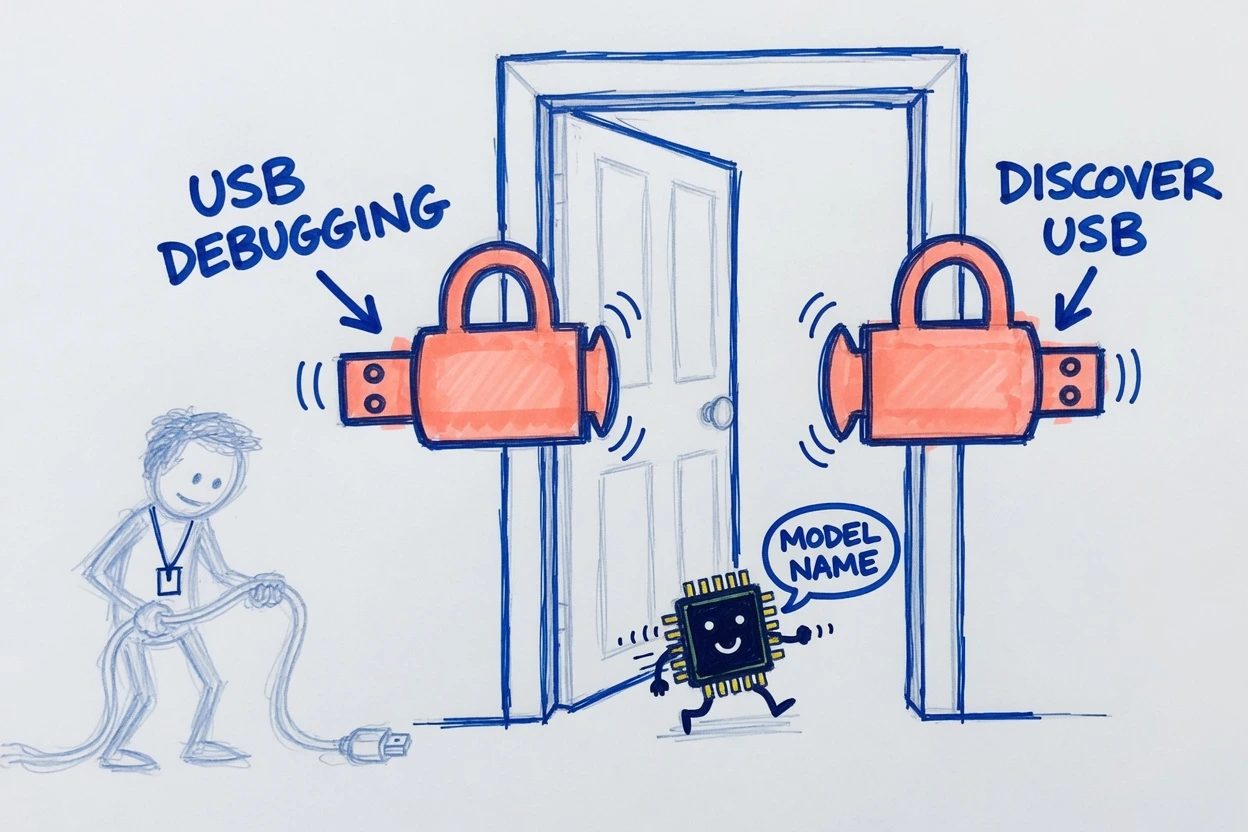
Model name is the connection. Inspect is the session. Open a real tab on the phone or the laptop has nothing to attach to.
4. Open Chrome on the phone and click Inspect#
Open Chrome for Android. Load the page that is actually broken. Back on chrome://inspect/#devices the model name is followed by its serial, then the Chrome version in parentheses. Each remote tab gets its own section. Click Inspect next to that URL. A new DevTools window opens.
That window is the end of the title's promise. Hover an element in Elements and the phone highlights it. Select Element, then tap the phone, and the node selects in the laptop panel. The first tap disables Select Element again, so re-enable it every time. Annoying. Documented.
The Chrome version on the phone picks the DevTools skin that opens. An old phone Chrome can drop a DevTools window that looks nothing like the one on the laptop. That is version skew, not a failed inspect.
Screencast is optional. It maps clicks to taps and hides the phone chrome as transparent gaps. Turn it off when measuring scroll or animation, because Chrome's docs say screencasts hurt frame rates.
When the Devices list is still empty#
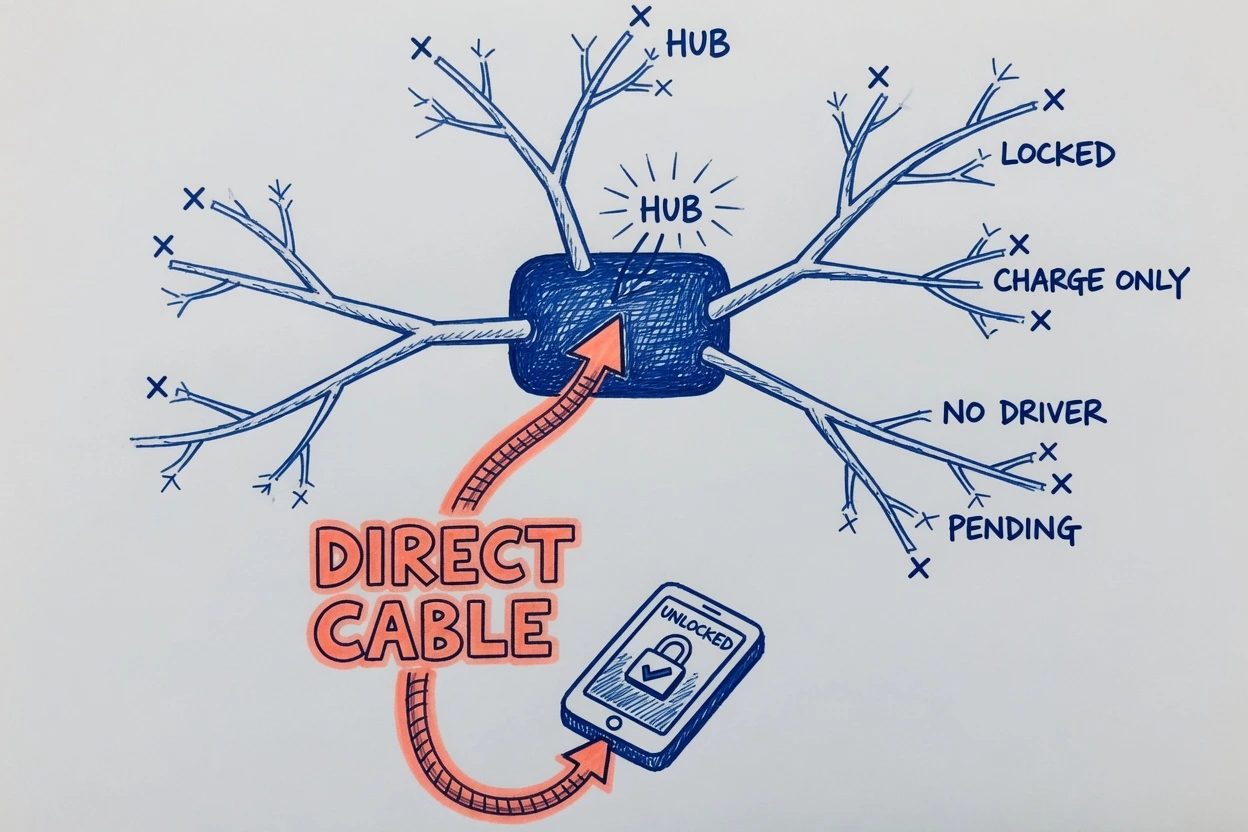
This is the fat section on purpose. The official happy pathPATHThe shell environment variable listing directories searched in order when a command name is typed, so every lookup walks each entry until one matches.See also WSLENV, appendWindowsPath, command lookup is short. The empty list is where a day disappears. Chrome's troubleshooting is a pile of hardware lies, not a mystery bug in inspect.
- Hub in the path, so unplug and go straight into the machine
- Either screen locked, so the Allow prompt never shows
- Charge-only cable, so files never appear on the laptop
- Windows missing the OEM driver, especially on a Samsung phone
- Pending authentication until the phone prompt is tapped
If files never show up on the laptop, the cable is charge-only. Swap it. Replug with both screens unlocked. Skip the hub. Set USB mode to PTP if the Allow USB debugging prompt never appears, which Chrome's docs still recommend for some Samsung stacks. Then revoke USB authorizations and plug in again so the RSA prompt is forced.
Windows is the other tax. Install the OEM USB driver from Android's table, not a random pack. Samsung on Windows is the combo Chrome names out loud. Device Manager should stop showing a yellow unknown device after that driver lands. macOS and Linux skip this step, which is why the same phone works on a Mac and ghosts on a Windows box.
Model name listed, no Inspect. Open Chrome on the phone. A tab has to exist before inspect has something to attach to. Use the Open tab with url box on the inspect page if poking the phone is a pain. If the target is a native WebView, Android's WebView DevTools guide is the other gate. setWebContentsDebuggingEnabled is off by default. The debuggable manifest flag does not flip it.
You'll ship a mobile CSS bug because Elements never opened, and the empty list will look like Chrome being flaky. It is usually a closed deadbolt, a costume cable, or a Windows driver that never installed.
Rare fallback, still not a skip of USB debugging. Chrome documents adb forward onto the phone's CDP socket. After that, chrome://inspect/#devices can fill even with Discover USB devices unchecked. USB debugging still has to be on. This is the escape hatch when Chrome's built-in discoverer and another adb server are fighting over the device.
adb devices -l
adb forward tcp:9222 localabstract:chrome_devtools_remote
adb devices -l has to list the phone first. Then http://localhost:9222/json lists page targets. That port number is the CDP forward, which is why it collides in the head with the agent flag. Same digits. Different job.
Inspect devices questions people actually hit
Why is chrome inspect devices still empty after the cable is in?
On the built-in USB path the list stays blank until USB debugging is on the phone and Discover USB devices is checked on the laptop. An authorized adb forward can fill the same page without that checkbox. First connect often shows Offline and pending authentication until the phone prompt is accepted.
asked on developer.chrome.com ↗Does Windows need a driver that Mac skipped?
Yes. Android's OEM USB driver page says Windows needs the manufacturer driver. macOS and Linux should not. Pixel and Nexus on Windows use Google's USB driver. Samsung and other OEMs ship their own.
asked on developer.android.com ↗The phone model is listed. Where is the inspect link?
Open Chrome on the phone first. A remote Chrome tab gets its own Inspect control. A native WebView stays hidden until the app calls setWebContentsDebuggingEnabled. Refresh chrome://inspect after the app is in the foreground.
asked on developer.android.com ↗Is --remote-debugging-port=9222 how you inspect a phone tab?
No. That flag, plus a non-default user-data-dir, attaches an agent to desktop Chrome. The phone path is Discover USB devices on chrome://inspect#devices. Chrome 136 ignores 9222 on the default profile.
asked on developer.chrome.com ↗Will an iPhone show up on chrome inspect devices?
Not on this page. Chrome for iOS 115 and later debugs through Safari Web Inspector on a Mac after Web Inspector is enabled in Chrome's Content Settings. The laptop Devices list is an Android USB surface.
asked on developer.chrome.com ↗Leave 9222 for the agent#
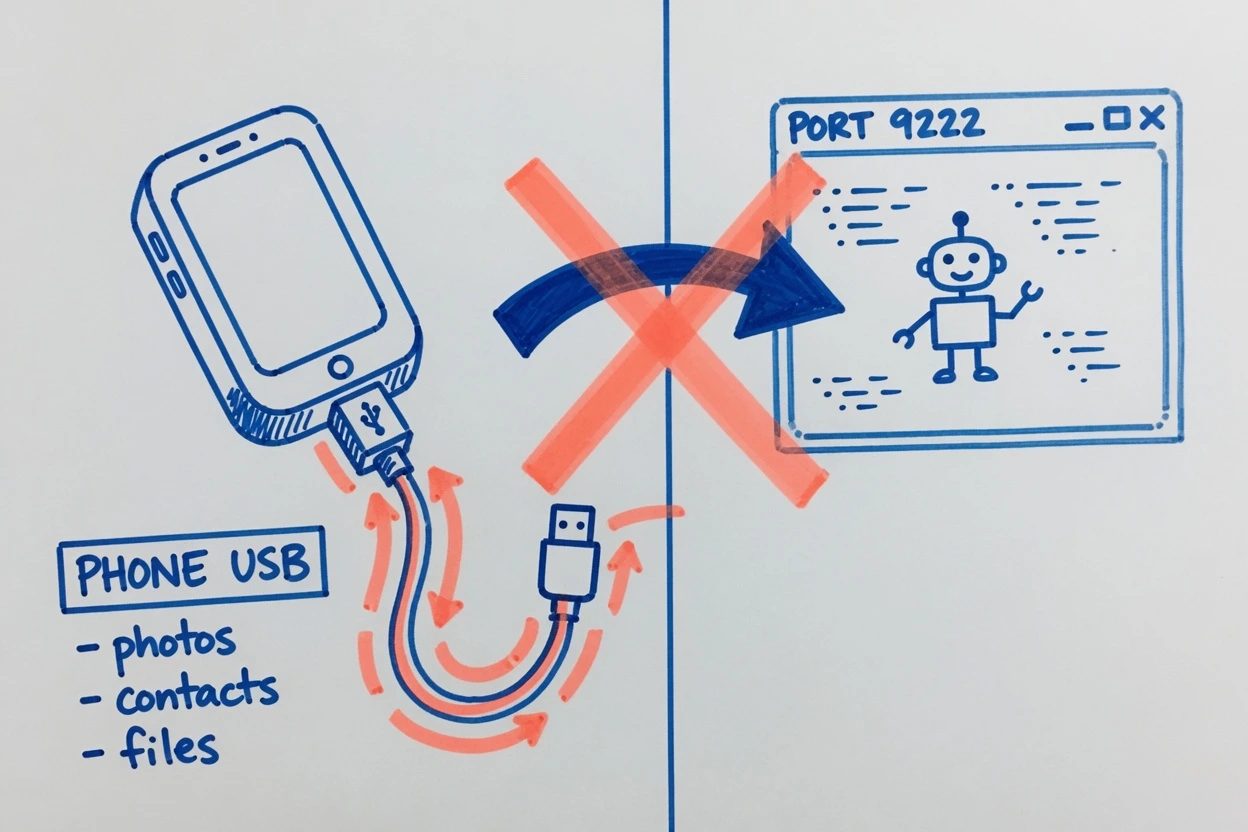
Coding agents keep sending people to --remote-debugging-port=9222. That flag talks to desktop Chrome. Chrome's agent configuration wants chrome://inspect/#remote-debugging or a Chrome process started with 9222 plus a non-default --user-data-dir. Chrome 136 ignores 9222 on the default profile on purpose, because infostealers were milking it.
chrome-devtools-mcp's default is a fresh Chrome profile on the laptop. Its Android doc is experimental, still starts with Enable USB Debugging, then the same adb forward line, then a WebSocket endpoint. That is an agent driving Chrome on the phone, not the Inspect link this title is about. Mix the two and chrome inspect devices stays empty while a sandbox Chrome on 9222 lights up just fine.
Same shape as treating the VS Code agent host as a panel. The surface looks adjacent. The process is not. iPhone tabs do not belong here either. Chrome 115 on iOS 16.4+ debugs through Safari's Develop menu on a Mac after Web Inspector is enabled in Chrome's Content Settings.
What now exists#
The phone model name is on chrome://inspect#devices. A remote Chrome tab shows Inspect. Clicking it opens DevTools on that tab, and hovering a node paints it on the glass. That is the working session. Two switches, a real cable, a Windows driver if the laptop is Windows. USB debugging stays on until someone turns it off.