Open Console Chrome with Ctrl Shift J not I
August 25, 2026

The fastest way to open console chrome is Ctrl+Shift+J, one key over from the chord that dumped you in Elements. Ctrl+Shift+I is not Inspect. That chord restores last panel.
Chrome's Open DevTools page paints three shortcuts on purpose. C stands for CSS. J stands for JavaScript. Ctrl+Shift+I designates your choice, meaning whatever panel you used last.
People mash Ctrl+Shift+I because MDN's beginner page teaches that chord or F12, then says the tools usually open on the inspector. The Console tab is a second click. That is the whole mess.
End state is a Console tab with a prompt that evaluates against this page. Not a phone. Not a PDF plugin. This tab.
What has to be true first#
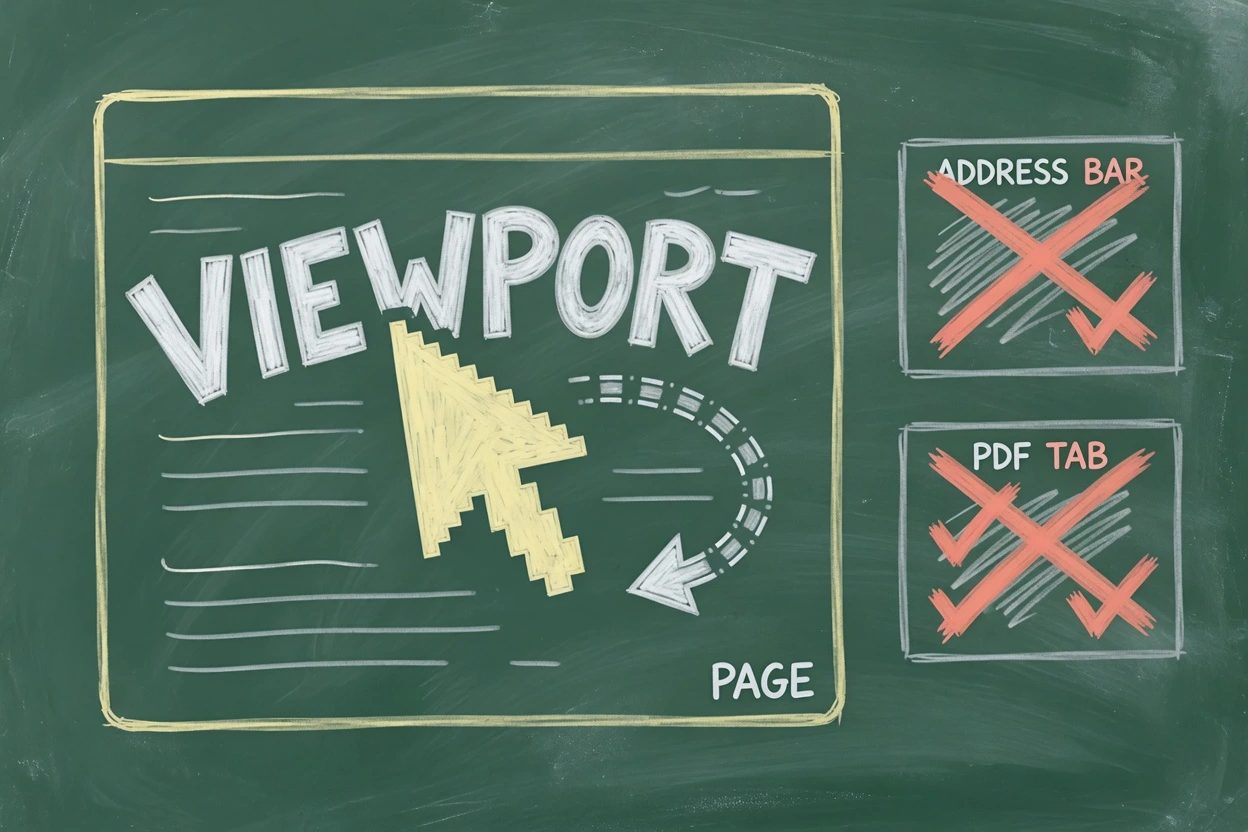
Desktop Chrome. Windows, Linux, macOS, or ChromeOS. The JavaScript tutorial names all four in the same J line.
- A normal web page,
https://in the address bar, not a PDF viewer tab - Keyboard focus in the page, not the address bar and not a
<textarea> - No managed policy that greys out Developer Tools
A phone tab is a different door. That is chrome://inspect#devices after USB debugging. Do not spend this shortcut on it. A VS Code panel is a different object again, a process, not a panel.
The shortcut table is blunt about focus. Keys only fire with the viewport focused.
How to open console chrome on this tab#
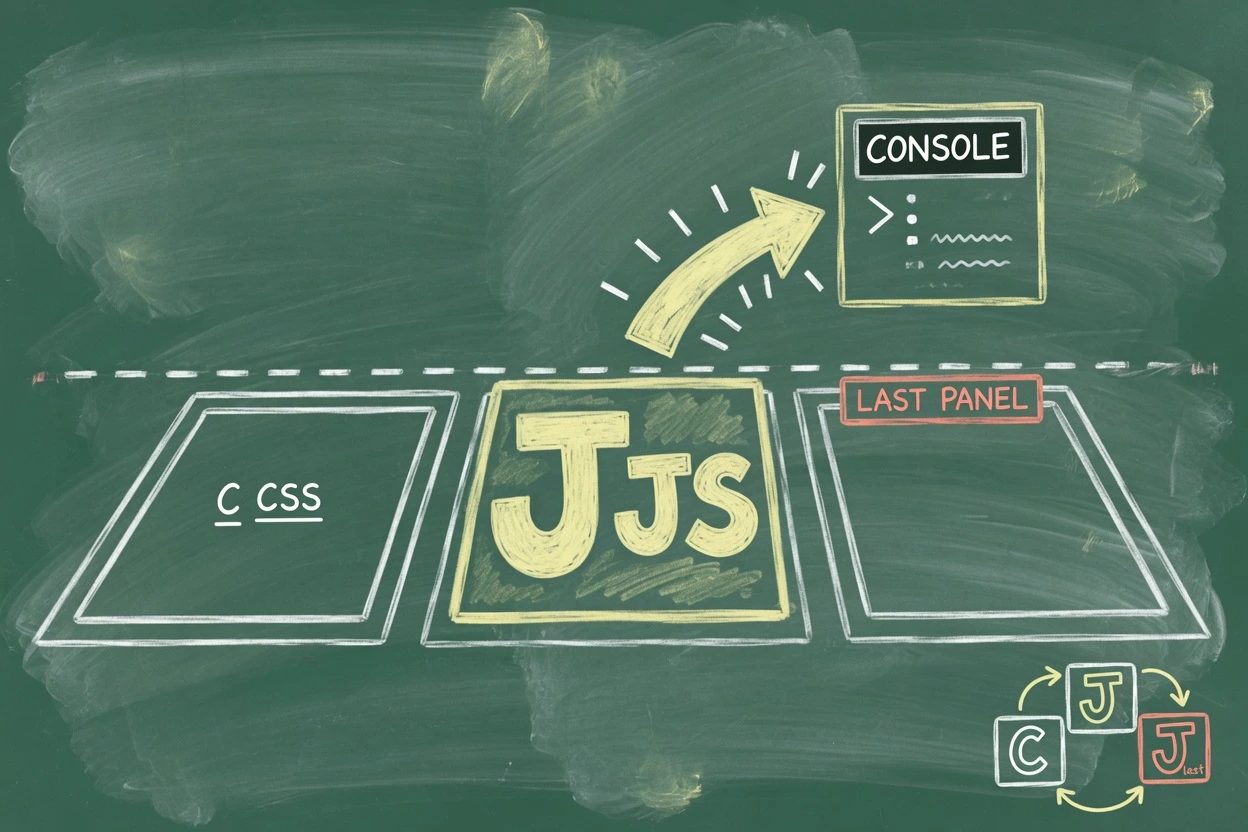
Think of C, J, and Ctrl+Shift+I as three parking spots painted on the same curb. Everyone pulls into the last-panel spot because that is where the car already was. Console lives in J. The official mnemonic is sitting on Chrome's Open DevTools page and almost no ranking how-to repeats it.
1. Press J to open console chrome#
Windows, Linux, ChromeOS. Ctrl+Shift+J. Mac. Cmd+Option+J. The shortcuts table labels that row Open the Console panel.
Skip Ctrl+Shift+I. That chord and F12 reopen the last panel. If that last panel was Elements, Ctrl+Shift+I looks like Inspect. It is not.
Look for this. The Console tab is selected. A prompt sits at the bottom. You are not looking at a DOM tree.
The three open chords
| Job | Windows and Linux | Mac |
|---|---|---|
| Console panel | Ctrl+Shift+J | Cmd+Option+J |
| Last panel you used | F12 or Ctrl+Shift+I | Fn+F12 or Cmd+Option+I |
| Elements in inspect mode | Ctrl+Shift+C | Cmd+Shift+C or Cmd+Option+C |
Right-click Inspect still opens Elements. That move is fine when you meant the DOM. It is the wrong first move when you wanted a REPL.
2. Type one line against this page#
Click the prompt. Type location.origin. Press Enter. The Console is a REPL with full access to the page window, which is why this line is the proof and not a vibe.
location.originYou should see this tab's origin come back. If 5 + 15 printing 20 feels quieter, that is the demo on Chrome's own JS tutorial. Same prompt. Same proof.
You'll ship a fake debug session if the context drop-down is sitting on an iframe ad instead of top. Flip it to top before you trust the number.
3. Use the Chrome menu if the page eats keys#
Some pages capture keydown and swallow F12. The chord goes into the page. DevTools never moves. Super boring when it happens.
Click the three-dot button to the right of the address bar. More Tools, then Developer Tools. Then click Console. Chrome's open page documents that menu as the last-panel path. It does not care what the page did with your keyboard.
Backup. Click the address bar so focus leaves the page, then F12, then the Console tab. Esc with DevTools already open toggles the Console drawer under whatever panel you were on. That is a prompt too. The dedicated panel from J is still the one to keep.
When you cannot open console chrome#
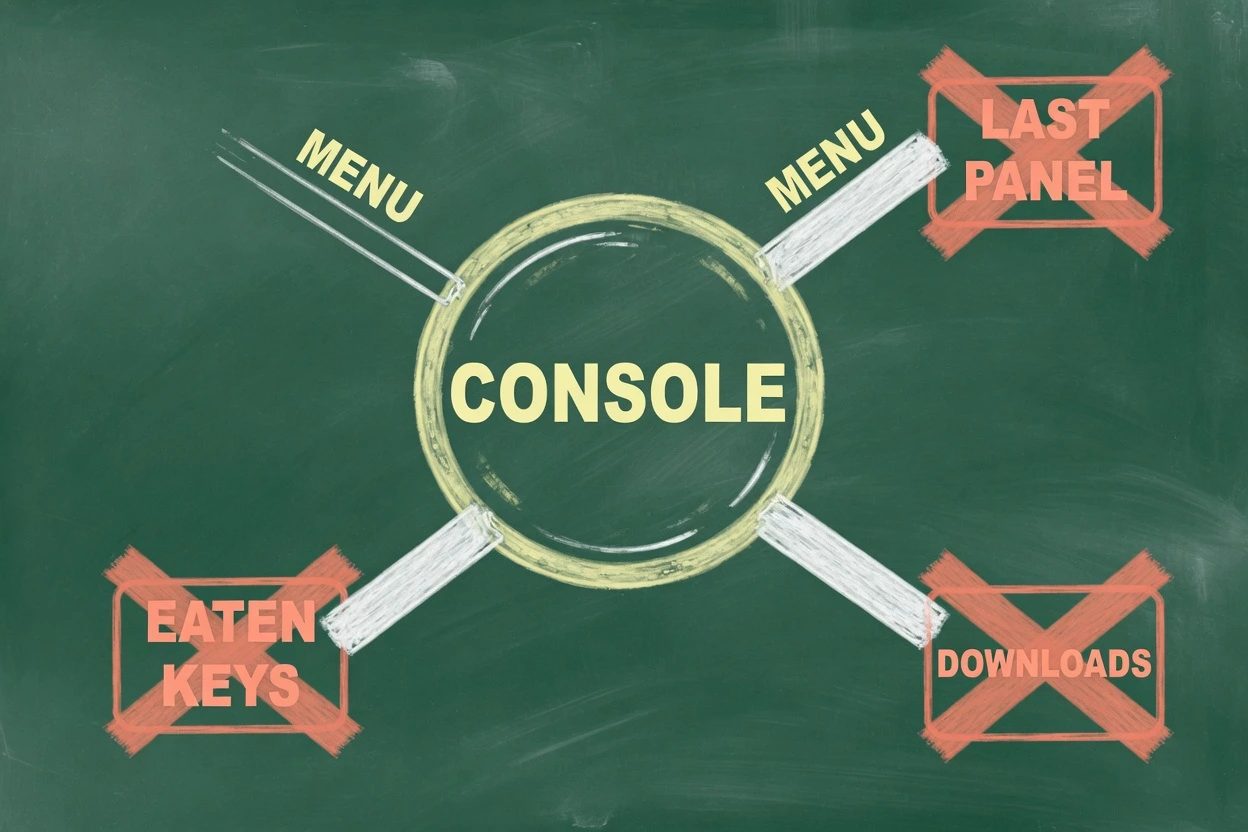
Three failures show up in the wild. None of them print a nice error string. The UI just goes somewhere else, or nowhere.
- Last panel.
Ctrl+Shift+Iand F12 restore whatever you used yesterday, often Elements. - Downloads. Windows Ctrl+J (no Shift) and Mac Cmd+Shift+J open chrome://downloads.
- Eaten keys. A page captured keydown, or
chrome://policygreys out Developer Tools.
Chrome Help on Windows even prints Ctrl+Shift+J or F12 on one Open Developer Tools row. That row is how the mix-up stays official-looking. On Mac, Help actually splits them. Open Developer Tools is Cmd+Option+I. Open the JavaScript Console is Cmd+Option+J.
Trust the DevTools table, not the Windows Help mash-up. Close Downloads if you landed there and hit the chord again. Menu path still works unless policy disabled Developer Tools for real.
A PDF tab is a plugin wrap, so Inspect sees wrapper HTML, not the document you think you opened. For a device, stop and use chrome://inspect#devices instead of this shortcut.
Escape toggles the drawer. J opens the panel. Already on Elements and just need a prompt? Esc is faster. Wanted Console as the tab? Press J.
Console shortcut questions last panel does not answer
What is the keyboard shortcut to open the Chrome console?
On Windows, Linux, and ChromeOS it is Ctrl+Shift+J. On Mac it is Cmd+Option+J. That chord opens the Console panel, not the last panel you used. F12 and Ctrl+Shift+I reopen whatever you used last, which is often Elements.
Does F12 open the Console?
F12 opens whatever DevTools panel you used last. If that was Elements, F12 looks like Inspect. The dedicated Console panel is still J. Chrome Help on Windows even prints Ctrl+Shift+J or F12 on the same Open Developer Tools row, which is how the mix-up stays alive.
asked on stackoverflow.com ↗Why did J open Downloads instead of the Console?
On Windows, Ctrl+J is Downloads. Console needs the Shift. On Mac, Cmd+Shift+J is Downloads and Cmd+Option+J is the Console. Mixing Shift and Option is the whole miss.
asked on support.google.com ↗What if a site blocks right-click Inspect?
Skip the context menu. Ctrl+Shift+C (Cmd+Shift+C or Cmd+Option+C on Mac) opens Elements in inspector mode. Ctrl+Shift+J still opens Console. If the page also eats those keys, use the three-dot menu, More Tools, Developer Tools.
asked on stackoverflow.com ↗What now exists#
A Console tab on this page. A prompt that takes location.origin and prints this origin. That is the working thing.
The Console overview is logs plus a REPL. You already have both. C still inspects. Ctrl+Shift+I still restores last panel. J is the one that opens Console chrome without the extra click.