Debugging + Developer Tools + JavaScript
Posts matching all selected tags.
Category
All Categories
Tags
1 more tagsFewer tags
Newsletter
New posts land in your inbox when they publish. No spam, unsubscribe anytime.
You're in. New posts head your way.
Filters3
Category
All Categories
Tags
1 more tagsFewer tags
4 posts
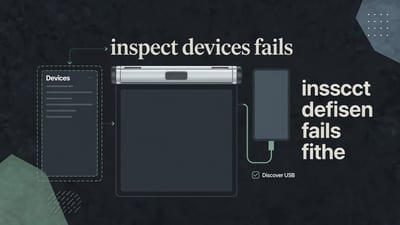
Chrome inspect devices fails until USB debugging is on
chrome inspect devices stays empty until USB debugging is on. Tick Discover USB devices, plug a data cable, then click Inspect on the listed phone tab.
Open Console Chrome with Ctrl Shift J not I
Open console chrome with Ctrl+Shift+J, not last panel. Land on a working prompt for this tab, skip Elements, and stop clicking the Console tab after F12.
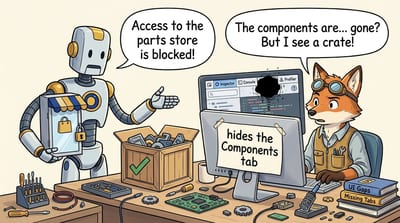
React Dev Tools Firefox still hides the Components tab
Get react dev tools firefox showing Components and Profiler. Install the AMO add-on, open a React page, reload, then find the tabs in the Toolbox not Console.
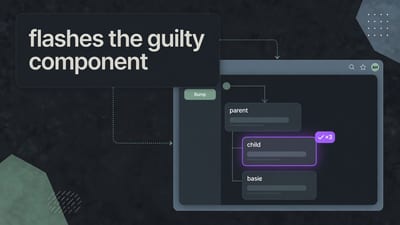
This react rerender tool flashes the guilty component
A react rerender tool paints a purple outline on the guilty memoized child. Drop the script before React, click once, then leave that Profiler closed.